
NHTSA FARS · 2019–2023 final files
Indiana fatal crashes
Five years of fatal crash counts, deaths and road-user involvement, compiled from federal crash records.
Data edition: 2019–2023 · Imported
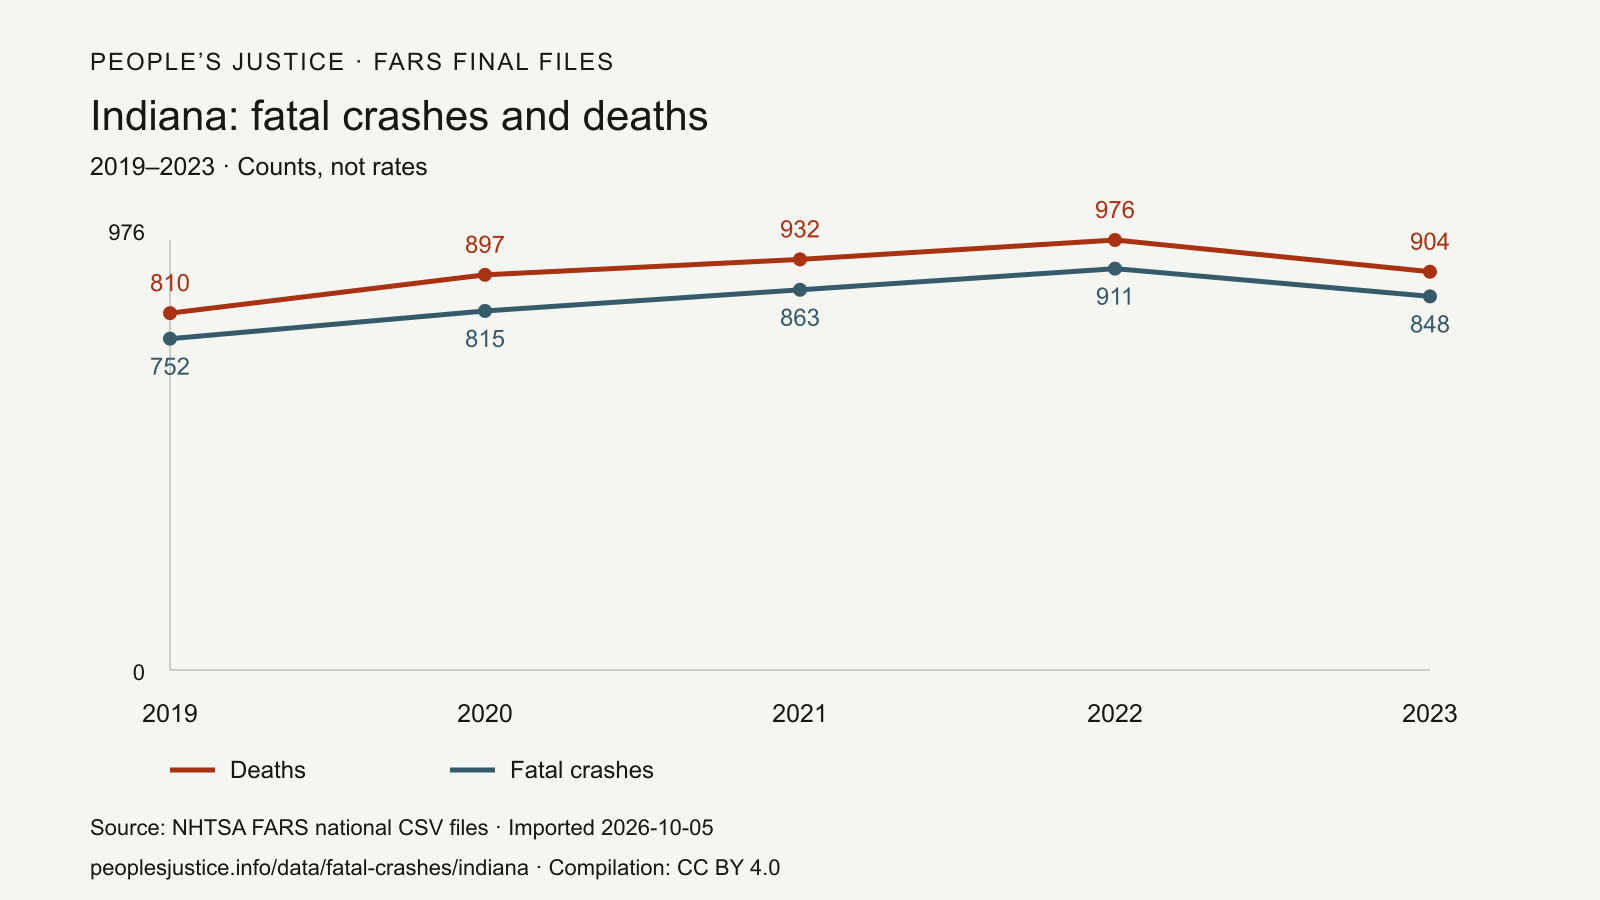
Fatal crashes and deaths, 2019–2023
Three findings from the records
- Indiana recorded 848 fatal crashes and 904 deaths in 2023.
- Deaths in 2023 minus deaths in 2019: +94 (904 − 810).
- Across 2019–2023, Indiana recorded 4,189 fatal crashes and 4,519 deaths.
Annual counts and involvement shares
Each share is an exact fraction of that year's fatal crashes. A crash involving more than one category appears in each applicable column; the shares do not add to 100%.
| Year | Fatal crashes | Deaths | Large truck share | Motorcycle share | Pedestrian share |
|---|---|---|---|---|---|
| 2019 | 752 | 810 | 125 of 752 | 128 of 752 | 75 of 752 |
| 2020 | 815 | 897 | 130 of 815 | 147 of 815 | 91 of 815 |
| 2021 | 863 | 932 | 157 of 863 | 137 of 863 | 112 of 863 |
| 2022 | 911 | 976 | 158 of 911 | 135 of 911 | 115 of 911 |
| 2023 | 848 | 904 | 133 of 848 | 144 of 848 | 98 of 848 |
Motorcyclist deaths, 2023
This section counts FARS PERSON records for killed motorcycle operators/riders and passengers, using motorcycle body-type codes in the same final files. Helmet unknown includes unknown, not-reported and not-applicable helmet-use codes.
| Measure | Deaths |
|---|---|
| Motorcyclist deaths | 145 |
| Helmet used | 42 |
| Helmet not used | 100 |
| Helmet unknown | 3 |
| Midnight-5:59 a.m. | 17 |
| 6:00-11:59 a.m. | 11 |
| Noon-5:59 p.m. | 53 |
| 6:00-11:59 p.m. | 64 |
| Time unknown | 0 |
| Single-vehicle crash | 62 |
| Multi-vehicle crash | 83 |
| Vehicle count unknown | 0 |
Road function classes, 2023
All recorded classes, ordered by fatal crash count. Unknown and not-reported classes are retained. These counts have no road-mileage or traffic-volume denominator.
| NHTSA road function class | Fatal crashes |
|---|---|
| Other Principal Arterial (3) | 232 |
| Major Collector (5) | 185 |
| Minor Arterial (4) | 168 |
| Local (7) | 120 |
| Interstate (1) | 92 |
| Minor Collector (6) | 38 |
| Other Freeways and Expressways (2) | 13 |
Top counties by fatal crash count, 2023
Up to ten recorded counties or county equivalents, ranked by fatal crashes, with county code breaking ties. Not-applicable, other, not-reported and unknown county entries are excluded from this ranking. County counts are not adjusted for population or vehicle miles traveled.
| County or county equivalent | FARS county code | Fatal crashes | Deaths |
|---|---|---|---|
| MARION (97) | 97 | 125 | 131 |
| LAKE (89) | 89 | 53 | 55 |
| ALLEN (3) | 3 | 35 | 39 |
| ST JOSEPH (141) | 141 | 28 | 31 |
| VANDERBURGH (163) | 163 | 24 | 24 |
| HAMILTON (57) | 57 | 23 | 24 |
| LA PORTE (91) | 91 | 23 | 26 |
| TIPPECANOE (157) | 157 | 20 | 21 |
| MADISON (95) | 95 | 19 | 21 |
| ELKHART (39) | 39 | 18 | 20 |
Methodology, definitions and limits
2019–2023 are the latest five final FARS years. The official 2024 national CSV ZIP exists, but NHTSA’s April 2026 manual and research note identify 2024 as the Annual Report File (ARF), subject to revision, and 2023 as Final. This compilation therefore excludes 2024. See NHTSA's April 2026 release note for the final-file and Annual Report File distinction.
NHTSA defines a qualifying FARS crash as involving a motor vehicle on a trafficway customarily open to the public and a vehicle occupant or nonoccupant who dies within 30 days of the crash. FARS is a census of qualifying fatal crashes, not an estimate of all crashes or injuries.
Each ACCIDENT.csv record is one fatal crash; deaths are the sum of its FATALS field. Involvement uses NHTSA's official ACC_AUX.CSV crash flags: A_LT for large trucks, A_MC for motorcycles and A_PED for pedestrians. A value of 1 means yes. The auxiliary and accident files are joined by STATE and ST_CASE, so each crash counts once per category. A person or vehicle need not have died for its involvement to count. Involvement does not establish fault or causation.
NHTSA defines large trucks as commercial or noncommercial trucks with a gross vehicle weight rating over 10,000 pounds. Motorcycles include motorcycles, motor scooters and mopeds within NHTSA's classification; pedestrian involvement uses NHTSA's pedestrian flag. Vehicle classification began using vPIC in 2020, and NHTSA cautions that these vehicle-type counts are not comparable with 2019 and earlier. Beginning in 2022, motorized bicycles were classified as pedalcycles rather than motorcycles; crashes involving only motorized bicycles are no longer included in FARS. These changes affect involvement comparisons across years.
The motorcycle section counts killed motorcycle operators/riders and passengers from PERSON.csv, using INJ_SEV, PER_TYP, BODY_TYP, HELM_USE, HOUR and VE_FORMS in the same final-file records. Alcohol involvement is omitted from this edition because NHTSA's alcohol-impaired-driving measure uses BAC values reported to FARS and BAC values imputed when test results are unknown; this compilation does not impute missing BAC values.
The national total includes the 50 states and District of Columbia, and excludes Puerto Rico. Road classes use FUNC_SYS in ACCIDENT.csv; county names and codes use COUNTYNAME and COUNTY. Road and county tables cover 2023; county tables are limited to ten records per state. Downloads retain these same scopes.
Shares divide the distinct involved-crash count by all fatal crashes in the same geography and year. We publish the numerator and denominator without percentage rounding. A death difference subtracts the first year from the last; five-year totals sum the annual counts. No adjustments, estimates or forecasts are added.
Vehicle miles traveled are not supplied in these imported FARS CSV files, so this edition does not report deaths per 100 million VMT. Counts alone do not compare exposure or establish which state, county or road class has a greater crash risk.
People's Justice is a legal-information publisher, not a law firm. Review our publishing methodology or request a correction.
Official definitions and source files
- NHTSA FARS scope and 30-day fatality definition
- FARS Analytical User’s Manual, 1975–2024 (April 2026), Appendix C and D
- FARS Auxiliary Datasets Analytical User’s Manual, 1982–2019 (A_LT, A_MC, A_PED)
- Overview of Motor Vehicle Traffic Crashes in 2024 (April 2026), release status
- 2019 final national CSV ZIP
26,974,033 bytes · SHA-256 0974abb92cfb04fa022631a838a3f46555025f2b011ee78ecad15bcf86c60f31
- 2019 final national auxiliary CSV ZIP
1,199,251 bytes · SHA-256 2b6f6b3fbb0df40b671ae25624414355ef396b7bb8b60e8a2e70d99fd20c78be
- 2020 final national CSV ZIP
31,016,385 bytes · SHA-256 b2806902b3da9b45c632499f82e1c74fd108238ae7f67e108ebf40360ee4c9c3
- 2020 final national auxiliary CSV ZIP
1,379,610 bytes · SHA-256 80af9b7590bb28d1f9c2b79537d8b575caab90b800bfce382a1d55163625def1
- 2021 final national CSV ZIP
35,190,858 bytes · SHA-256 743c19a13884614430d295289e655c5ad32b0a025a11e5b2149dfb57acae389b
- 2021 final national auxiliary CSV ZIP
1,603,736 bytes · SHA-256 2edca36bae8ea35ea2cf45d7fbf3cc2438315e8c8ca02fc320b8466fec5ecc40
- 2022 final national CSV ZIP
34,689,724 bytes · SHA-256 989448d7a2f3964264c96a3cdb220f6c413c782a33eb759781f520c5acb5f744
- 2022 final national auxiliary CSV ZIP
1,584,260 bytes · SHA-256 04c80f9e72e442c1e1e0a9d4e6cdc3771ec1b3860a68587599ebb79e12a023b6
- 2023 final national CSV ZIP
34,174,899 bytes · SHA-256 edde841eb493e55751961b36bac2d1ce8750f601cb8e6e183a525723bb62bab0
- 2023 final national auxiliary CSV ZIP
1,523,858 bytes · SHA-256 caeb7297778962f14af01ff12d99cc61077d2c9c82774df8262884d7fc34ee98
Cite this · free to republish with credit
The chart and People's Justice compilation of public data are licensed under Creative Commons Attribution 4.0. Credit NHTSA as the original source and People's Justice for the compilation; link this page and identify any changes. This license does not imply NHTSA endorsement.
People's Justice. Indiana fatal crashes, 2019–2023. Compilation imported 2026-10-07. Source: NHTSA Fatality Analysis Reporting System, final national CSV files. https://peoplesjustice.info/data/fatal-crashes/indiana. Compilation licensed CC BY 4.0.All state records